Cadvisor and Prometheus

In our last article The container monitor – cadvisor,  we already introduce how to use cadvisor to collect containers’ metadata. So in this blog, we are going to introduce how to combine cadvisor and Prometheus to build a monitor system.

  • how to combine cadvisor and Prometheus.
  • check CPU, memory and network status in Prometheus.

How to combine cadvisor and Prometheus

Step1: add cadvisor into Prometheus as target:

#prometheus.yml

scrape_configs:
  - job_name: 'node'
    static_configs:
      - targets: ['127.0.0.1:9100']

  - job_name: 'container'
    static_configs:
      - targets: ['127.0.0.1:8080']  # access address of cadvisor

Step2: reload configuration of prometheus,visit http://localhost:9090/targets and you will see the cadvisorhas been added into Prometheus.

/images/cadvisor/prometheus01.png

Step3: visit graph page of Prometheus by http://localhost:9090/graph,and you will be able to search related data by container.

/images/cadvisor/prometheus02.png

Show CPU,memory and Network with Prometheus

CPU

sum by (name) (rate(container_cpu_usage_seconds_total{image!=""}[1m])) / scalar(count(node_cpu{mode="user"})) * 100

/images/cadvisor/prometheus03.png

Memory

sum by (name)(container_memory_usage_bytes{image!=""})

/images/cadvisor/prometheus04.png

Network(Import):

sum by (name) (rate(container_network_receive_bytes_total{image!=""}[1m]))

/images/cadvisor/prometheus06.png

Network(Export):

sum by (name) (rate(container_network_transmit_bytes_total{image!=""}[1m]))

/images/cadvisor/prometheus05.png

Disk

sum by (name) (container_fs_usage_bytes{image!=""})

/images/cadvisor/prometheus07.png

The container monitor – cadvisor

The containers have been wild used in a lot of places, but how the operators know the data like CPU, memory, network. The answer is cadvisor.

docker stats and cadvisor

As you know, the dokcer stats can check the status of Docker container like:

CONTAINER ID        NAME                CPU %               MEM USAGE / LIMIT    MEM %               NET I/O             BLOCK I/O           PIDS
a25dd77a5237        cadvisor            0.91%               14.8MiB / 1.952GiB   0.74%               749kB / 11.5MB      18.9MB / 0B         11

But you can not get data through HTTP and there was no panel for it.

With all these issues of dokcer stats ,  here comes cadvisor to deal with them.  You not only can usecadvisor to collect all the information of a container but also provide a way to let Prometheus display on UI.

So, the cadvisor is your first choice as container monitor.

How to install cadvisor

Step1: use docker pull to get the latest cadvisor

$ docker pull google/cadvisor:latest

Step2: use docker images to check the image version (optional)

$ docker images  

google/cadvisor      latest              75f88e3ec333        4 months ago        62.2MB

Step3:  docker run the images

sudo docker run \
  --volume=/:/rootfs:ro \
  --volume=/var/run:/var/run:rw \
  --volume=/sys:/sys:ro \
  --volume=/var/lib/docker/:/var/lib/docker:ro \
  --volume=/dev/disk/:/dev/disk:ro \
  --publish=8080:8080 \
  --detach=true \
  --name=cadvisor \
  google/cadvisor:latest

with docker ps you will get the information

CONTAINER ID        IMAGE                    COMMAND                  CREATED             STATUS              PORTS                    NAMES
742a464fa631        google/cadvisor:latest   "/usr/bin/cadvisor -…"   1 second ago        Up 1 second         0.0.0.0:8080->8080/tcp   cadvisor

Step4: Vistit http://localhost:8080 :

/images/cadvisor/cadvisor-01.png

Congratulations!

Deep into cadvisor

Tips1: visit http://localhost:8080/docker you can check all the docker containers you have:

/images/cadvisor/cadvisor-02.png

Tips2: get the detail information by click one of them.

/images/cadvisor/cadvisor-03.png

/images/cadvisor/cadvisor-04.png

Tips3: Visit http://localhost:8080/metrics you can check all the data passed to  Prometheus :

/images/cadvisor/cadvisor-05.png

In conclusion:

Cadvisor is an awesome tool to collect and query data of container.

We will talking about how to use Prometheus and Grafana to monitor and alert next time.

HOW TO MONITOR YOUR SYSTEM WITH PROMETHEUS

prometheus

What’s Prometheus?

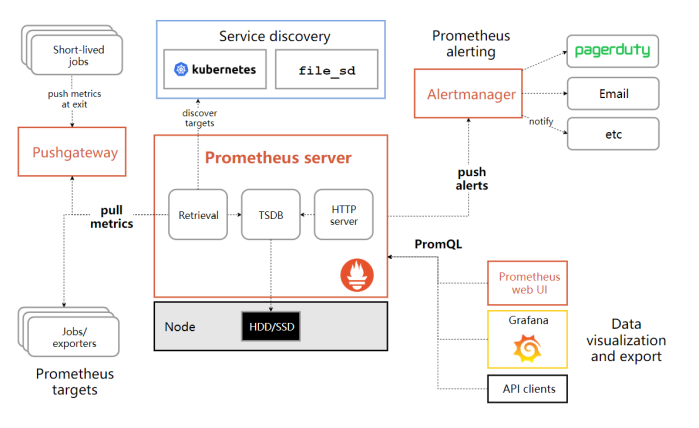
Prometheus is a monitoring system and time series database with Golang.  It collects metrics from configured targets at given intervals, evaluates rule expressions, displays the results, and can trigger alerts if some condition is observed to be true.

Environment Setup:

  • linux amd64 (ubuntu server)
  • Golang Development Environment

Step 1 — Install Prometheus Server

Create a Download folder if you don’t have one, yet.

mkdir ~/Download
cd ~/Download

Get Prometheus by wget

wget https://github.com/prometheus/prometheus/releases/download/v2.3.2/prometheus-2.3.2.linux-amd64.tar.gz

Then you need to untar it

tar -xvzf ~/Download/prometheus-2.3.2.linux-amd64.tar.gz
cd prometheus-2.3.2.linux-amd64

You could check it by the command below to see if everything works well

./prometheus version

If things go well, then you should see something like:

prometheus, version xxx (branch: master, revision: xxxx)
  build user:       xxx
  build date:       xxx
  go version:       xxx

Step 2 — Install Node Exporter

Node Exporter is the most basic exporter provide by Prometheus,  and it will collect machine metrics like CPU, Memory, Disk, etc.

Use wget get Node Exporter

cd ~/Download
wget https://github.com/prometheus/node_exporter/releases/download/0.12.0/node_exporter-0.12.0.linux-amd64.tar.gz

and  tar to untar node_exporter-0.12.0.linux-amd64.tar.gz

cd ~/Prometheus
tar -xvzf ~/Download/node_exporter-0.12.0.linux-amd64.tar.gz
cd node_exporter-0.12.0.linux-amd64

Step 3 — Run Node Exporter

Same like Prometheus, you could use ./node_exporter to run Node Exporter to check  if everything works well:

INFO[0000] Starting node_exporter (version=0.12.0, branch=master, revision=df8dcd2)  source=node_exporter.go:135
INFO[0000] Build context (go=go1.6.2, user=root@ff68505a5469, date=20160505-22:15:11)  source=node_exporter.go:136
INFO[0000] No directory specified, see --collector.textfile.directory  source=textfile.go:57
INFO[0000] Enabled collectors:                           source=node_exporter.go:155
INFO[0000]  - loadavg                                    source=node_exporter.go:157
INFO[0000]  - textfile                                   source=node_exporter.go:157
INFO[0000]  - time                                       source=node_exporter.go:157
INFO[0000] Listening on :9100                            source=node_exporter.go:176

Just visit http://IP:9100/metricsif you want to see what’s the data looks like which collected by node exporter.

# HELP go_gc_duration_seconds A summary of the GC invocation durations.
# TYPE go_gc_duration_seconds summary
go_gc_duration_seconds{quantile="0"} 0
go_gc_duration_seconds{quantile="0.25"} 0
go_gc_duration_seconds{quantile="0.5"} 0
. . .

Note: of course you could put  node_exporter to add it into service and make it start with the system.

Step 4 — Start Prometheus Server

You need to edit  prometheus.yml to config prometheus.

cd ~/Prometheus/prometheus-2.3.2.linux-amd64
nano prometheus.yml

Add things as follow:

scrape_configs:
  - job_name: "node"
    scrape_interval: "10s"
    static_configs:
      - targets: ['127.0.0.1:9100']
  • scrape_configs : represent a list of config that Prometheus will scrap as target
  • job_name : represent the name of  node
  • static_configs :  targets ‘s address

Reference:  https://prometheus.io/docs/operating/configuration/

Restart prometheus after you change the config file

./prometheus

You should see messages as follow if everything works well.

NFO[0000] Starting prometheus (version=1.1.0, branch=master, revision=5ee84a96db6190d4fcdaf4eff74a09b52824a9aa)  source=main.go:73
INFO[0000] Build context (go=go1.6.3, user=root@54c6975115bb, date=20160903-19:04:27)  source=main.go:74
INFO[0000] Loading configuration file prometheus.yml     source=main.go:221
INFO[0000] Loading series map and head chunks...         source=storage.go:358
INFO[0000] 974 series loaded.                            source=storage.go:363
WARN[0000] No AlertManagers configured, not dispatching any alerts  source=notifier.go:176
INFO[0000] Starting target manager...                    source=targetmanager.go:75
INFO[0000] Listening on :9090                            source=web.go:233

You can visit http://IP:9090 to check the panel that prometheus provide.

https://i0.wp.com/7o512j.com1.z0.glb.clouddn.com/prometheus-graph.png

The prometheus provide the basic search methos like PromQL .

https://i0.wp.com/7o512j.com1.z0.glb.clouddn.com/prometheus-load1.png

In conclusion:

    • The installation of  Prometheus is very easy.
    • You need grafana as dashboard if you want a beautiful UI.

GSoC in Shogun – week 3

During this week, I focused on removing the global random variable. Basically speaking, I removed the global random(sg_rand), then introduced a variable(CRandom* m_rng) in SGObject and which can be used everywhere.

Benchmark for stander random and CRandom

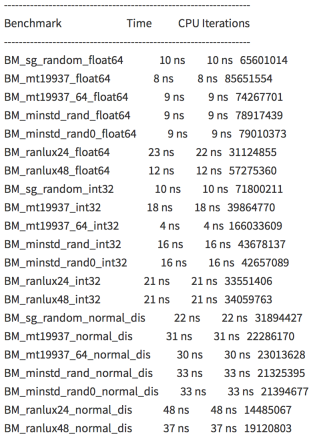
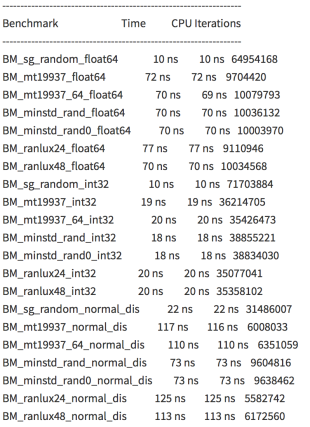
The original idea of Wiking and me was to replace CRandom with the c++11 random framework. So we did some benchmark experiments about the performance of the standard random generator and CRandom, and the results we got were very interesting: we found, a huge difference between the gcc and clang implementations (left and right, respectively).

we found, as wiking said, there are some crazy difference between the clang and gcc’s implementation(the left one is the result obtained from gcc and the right one from clang).

Screen Shot 2017-06-27 at 10.17.46 PMScreen Shot 2017-06-27 at 10.18.04 PM

From the result you can see gcc has better random implementation than clang, and CRandom is better than the C++11 random generator on clang(\o/)

Remove sg_rand

Even though we know that the C++11 random framework could improve our performance on random, if we want to build it into Shogun, we need to start the refactor with small steps, because random is used so much. In order to avoid broken unit tests, we need to get rid of sg_rand and use a variable in SGObject to instead of it. I haven’t done this job yet, because even though it only needs adding a couple of lines to make things work, there are over 100 files involved into this issue so I must test each thing carefully first. Hopefully I can commit a pr within this week, and the progress about this issue can be found in get_rid_of_sg_rand branch.

Some other issues

In the last week, I did some GMM refactoring by SGVector and linalg lib, and fixed the broken GMM notebook. When working on GMM and Gaussian, I found that their max likelihood computation are actually duplicated. And as Heikos commented on the pr, we are going to further re-design the GMM and CMixtureModel. Another issue wasto add a Gaussian checkerboard fixture and use it to generate BinaryLabel and MultipleClassLabel data for unit tests. I created that pr a couple of weeks ago and I was struggling with the DynamicArray issue then. Most things I do is to copy and paste the data generator function in SVMOcas_unittest and make it global. Some loop like:


for (index_t i = 0, j = 0; i < data.num_cols; ++i)
{
    if (i % 2 == 0)
        train_idx[j] = i;
    else
        test_idx[j++] = i;
}

Which is very hard to read and maintain. Actually, I also spend a lot of time to figure out what exactly it is supposed to do. Therefore, I will refactor it ASAP.

PR in progress:
https://github.com/shogun-toolbox/shogun/pull/3859
https://github.com/shogun-toolbox/shogun/pull/3876

PR been merged:
https://github.com/shogun-toolbox/shogun/pull/3866
https://github.com/shogun-toolbox/shogun/pull/3857
https://github.com/shogun-toolbox/shogun/pull/3852
https://github.com/shogun-toolbox/shogun/pull/3812(need refactor)

GSoC in Shogun – week 1 & week 2

First of all, my major job is about to use std::vector instead of DynArray in CDynamicArray. But due to my carelessness and irresponsible, the works described in this blog actually shouldn’t take so long to deliver. I do meet some issues during this two weeks and went into some kind of dilemma, but it shouldn’t take 2 weeks anyway.

Stage – 1(try to use std::vector instead of DynArray directly)

std::vector is the first choice as the alternative of DynArray, it’s dynamic, check, it has almost same interface with DynArray, check, and the most beautiful thing is I don’t know to manually manage the memory by using it.(How naive I am :/)

Ok, after I replace all the DynArray with std::vector directly, the compiler complain like:

error: invalid initialization of non-const reference of type ‘bool&’ from an rvalue of type ‘bool’

And do some research, I found this(https://stackoverflow.com/a/7376997) for it. And I quote part of wiki:

The Standard Library defines a specialization of the vector template for bool. The description of this specialization indicates that the implementation should pack the elements so that every bool only uses one bit of memory.

looks like I should find another way.

Stage – 2(maybe std::deque is a better choice?)

So I need a container, it must be dynamic and support random index, so it can return reference to bool. Ok, I guess std::deque is something we want. The “only” difference is we can’t direct access to the underlying array,


auto it = m_array.begin();

return &(*it);

But, as wiking said, the elements in deque are not contiguous in memory and the serialization of this object will be broken as result.

Stage – 3(wait! Maybe const_reference and const_pointer works for vector)

After talk with iglesiasg on irc,  I found the std::vector<bool> specialization defines std::vector<bool>::reference as a publicly-accessible nested class. std::vector<bool>::reference proxies the behavior of references to a single bit in std::vector<bool> and it can return reference as usual if it’s not bool element. How sweet! But, however, it proves that it’s impossible to return a plain pointer by vector::const_pointer. 

Stage – 4(Oh man, just use template specification)

If we can’t make vector works, why not stop using it? So we got:


template  class CDynamicArray : public CSGObject
{}

template  class CDynamicArray : public CSGObject
{}

Watch out!  The template definition should be in one line, otherwise our class_list.cpp.py doesn’t know how to handle it[see github comment for more][and here]. Alright, do you think it’s good to go now? NO! We still got so many errors:

1 – unit-DynamicObjectArray (SEGFAULT) 8 – unit-SGObject (OTHER_FAULT) 12 – unit-GaussianProcessClassification (SEGFAULT) 73 – unit-LineReaderTest (Failed) 81 – unit-CommUlongStringKernel (SEGFAULT) 222 – unit-LogPlusOne (SEGFAULT) 223 – unit-MultipleProcessors (SEGFAULT) 226 – unit-RescaleFeatures (SEGFAULT) 265 – unit-SerializationAscii (OTHER_FAULT) 266 – unit-SerializationHDF5 (OTHER_FAULT) 267 – unit-SerializationJSON (OTHER_FAULT) 268 – unit-SerializationXML (OTHER_FAULT) 343 – libshogun-evaluation_cross_validation_multiclass_mkl (OTHER_FAULT)

Where is the problem?

First problem is DynamicArray :: shuffle(). I shuffle things inside like


std:: shuffle(m_array.begin(), m_array.end())

and it will shuffle all the element in that vector rather than the elements been used. For example, if we have a vector with size 10 and we only use 5 elements in it. It will look like vector{1,2,3,4,5,0,0,0,0,0}. And then the std::shuffle() will make things like {0,1,2,0,0,3,0,4,0,5}. Actually we don’t want any zero in there.
The second problem is DynamicArray :: find_element(). Again, I use

std::find(m_array.begin(), m_array.end(), e)
inside and again, it failed :/

For example, if we have a vector with size 10 and we only use 5 elements in it. It maybe looks like vector{1,2,3,4,5,0,0,0,0,0}. I bet you already notice it, it will always return true if  we want to figure out if we have zero in that array. To fix it:

inline int32_t find_element(bool e)
{
int32_t index = -1;

int32_t num = get_num_elements();
for (int32_t i = 0; i < num; i++)
{
if (m_array[i] == e)
{
index = i;
break;
}
}
return index;
}

As conclusion:

These errors and bug actually not so hard to find out. But I just too trust STL and haven’t figure out what things I need exactly. After I found a bunch of segment fault, the first thing come cross my mind is “it’s a serious problem, I should ask my mentor”. If I have more patience and output all the variable step by step, things will been fixed very fast and wouldn’t wast too much time of my mentor(sincerely sorry to wiking). And I should write unit test before I start my work, so we can catch the problem at the beginning.

Relative entropy and mutual information

Consider some unknown distribution p(x), and suppose that we have modelled this using an approximating distribution q(x). If we use q(x) to construct a coding schemem for the purpose of transmitting values of x to a receiver, then the average additional amount of information required to specify the value of x as a result of using q(x) instead of the true distribution p(x) is given by: KL(p||q) = -\ln p(x)lnq(x)dx - (-\ln p(x)lnp(x)dx) = -\ln p(x)ln{\frac{q(x)}{p(x)}}dx and it’s known as relative entropy or Kullback-Leibler divergence or KL divergence. You could also define it as KL(p(x)||q(x)) = \sum_{x \in X}f(x) \dot log\frac{p(x)}{q(x)} we could give some conclusion in here: \n

1: The value of KL is zero if p(x) and q(x) are exactly same function.
2: If the difference between p(x) and q(x) is larger, the relative entropy will become bigger, otherwise, it will decrease if the variance is smaller.
3: If p(x) and q(x) are distribution function, the relative entropy could been used to measure the difference between them.

The thing need to point out is the relative entropy is not symmetrical quantity, that is to say KL(p||q) \neq KL(q||p)

Now consider the joint distribution between two sets of variables x and y given by p(x,y). If the sets of variables are independent, then their joint distribution will factorize into the product if their marginals p(x, y) = p(x)p(y). If the variables are not independent, we can gain some idea of whether they are ‘close’ to being independent by considering KL divergence between the joint distribution and the product of the marginals, given by: I[x,y] = \sum_{x \in X, y \in Y} P(x, y)log \frac{P(X,Y)}{P(X)P(Y)} or we can just say $I(X; Y) = H(X) – H(X|Y)$

Start from the Information Theory

It has been a long time since last update, part of reason is I need to work on my postgraduate paper, and, however, I’m a lazy man anyway 😛 Recently I’m reading about 《Pattern Recognition and Machine Learning》 and 《Beauty of Mathematics 》 which makes me to mark something down and help me to understand them better 🙂

The First thing I want to talk about is information theory, so if you need to predict an even is possible or not, the most straight forward way is you could use the history data to get its probability distribution P(X) depend on the value x. . So, if right now we want to evaluate the information content of x, we should find a quantify h(x) that is a monotonic function of the probability  P(X) that could expresses the information content. The way we could find that h(x) is, we need to have two events x and y that are unrelated with each other and then the information gain from observing both of them should be the sum of the information gained from each of them separately. so the h(x, y) = h(x) + h(y) and P(x, y) = p(x)p(y). The we could get h(x) = -log_{2}p(x) And you could find that the h(x) is actually represent the “bits”. Now, suppose that a sender wishes to transmit the value of a random variable to a receiver. The average amount of information that they transmit in the process is obtained by taking the expectation of h(x) with respect to the distribution p(x) and is given by H[x] = - sum_{x}p(x)log_{2}p(x). This important quantity is called the entropy of the random variable x. Consider a random variable x having 8 possible states and each of which is equally likely. In order to communicate the value of x to a receiver, we would need to reansmit a message of length 3 bits and the entropy is H[x] = -8 * \frac{1}{8}log_{2}\frac{1}{8} = 3 bits. Furthermore, if we have 8 possible states{a, b, c, d, e, f, g, h} for following strings: 0, 10, 110, 1110, 111100, .

So we have the ideal of entropy, then let’s see the other kind of differential entropy. When we minimize the value x and give a quantity ln\Delta, which diverges in the limit \Delta \rightarrow 0. For a density defined over multiple continuous variables, denoted collectively by the vector x, the different entropy is given by H[x] = - \int p(x)lnp(x)d_{x} which denote the fact that to specify a continuous variable very precisely requires a large number of bits.

Support we have a joint distribution P(x, y) from which we draw pair of values of x and y. If a value of x is already know, then the additional information needed to specify the corresponding value of y is given by -lnp(Y|X). Thus the average additional information needed to specify y can be written as H[y|x] = sum_{x\in \textup{x}, y\in \textup{y}}p(x,y)log \frac{p(x)}{p(x,y)} which called the conditional entropy of y given x. It’s easily seen, using the product rule, that the conditional entropy satisfies the relation: H[x,y] = H[y|x] + H[x]

Summary of SETA rewrite

capture20decc81cran202016-03-012009-48-111

It’s been three months since the GSoC started and it’s come to the end. First of all, I greatly appreciate my mentors (jmaher and armenzg) .  I have learned tons of things from them and it would have been impossible to get here without their help.  I also must say thank you to dustin, martiansideofthemoon and anyone who has helped me during these past three months. I really enjoy working with the people in the A-team and the Mozilla community. I believe I will keep being involved as long as possible!

This GSoC project involved several parts- (1) refactor SETA’s code and make it robust (2) make SETA work on Heroku (3) Reduce database size and use data from other systems (4) Integrate with the Gecko decision task

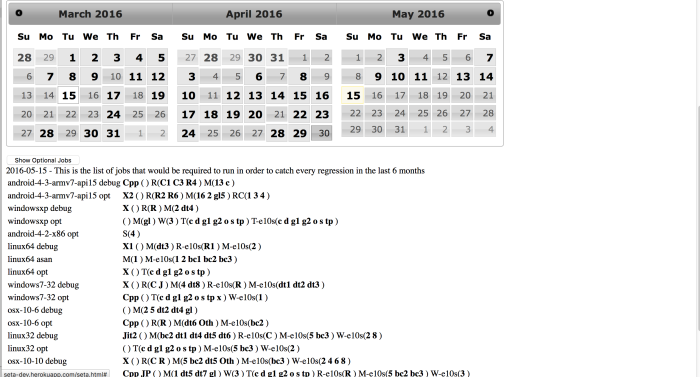
For code refactoring, we’ve fixed many existing pep8 errors and added flask8 support in #PR87 . We’ve also verified and removed some redundant packages from requirement.txt because we no longer needed them. Furthermore, in order to make the  codebase more readable and easy to test, we started using sqlalchemy to do the database operations instead of embedded SQL statements and added some tests for it in #PR109. Sqlalchemy turned out to be a fantastic choice  for us because it does not only makes tests easier to write, but it also give us faster database querying and storing. In #PR84, we use fetch_json instead of the pushlog endpoint which make things cleaner. As a bonus point, we fixed insert key errors in #PR92 and added a failure column in #PR82. We’ve also made SETA display job results appropriately in #PR90. In #PR91, we made linux64 debug jobs be visible on SETA. At the moment it’s not only useful on linux64 debug jobs but it also works for other job data that comes from Taskcluster.

Screen Shot 2016-05-15 at 8.39.18 PM

The second part of this project is make SETA works on heroku, and all the related PRs are included in MikeLing/ouija-rewrite branch. First of all, we need migrate our database from mysql to postgresql(it’s default database on heroku) and things become much more easier  after we switch to the sqlalchemy [PR]. Secondly, we need to make updatedb.py and failures.py(we use these two scripts to update our database and store our analysis results) running automatically[PR]. Then, we add a stage server for SETA, it could  do pre-deployment validation as what has been done in treeherder and avoid breaking something accidently in the target server. I must say thank you to armenzg again because he gives me a lot of  helps on this and helps me fork repo to the stage server. Anyway, we couldn’t works well on the heroku without armen’s help 🙂

The next step was about reducing database size and to use the data from another system. In #PR88, we made SETA only store high value jobs instead of low value job (because we only require around 165 high value jobs while there’s about 2000 low value jobs) and store 90 days of data instead of 180 days in our database. As Joel said, it’s a big win for reducing our database size:). In #PR89 we got rid of ‘logfile’ in the testjobs table because it wasn’t being used in the analysis of failures. Then, in #PR93 and #PR100 we started using the runnable API instead of the uniquejobs table and cached it as runnablejob.json locally. It allow us to query all job types and related information with more accuracy and on real time. As a bonus, we use underscore.js to simplify our JavaScript and make our js code more readable. Other related PRs are #PR112, #PR99, #PR105, and #PR106.

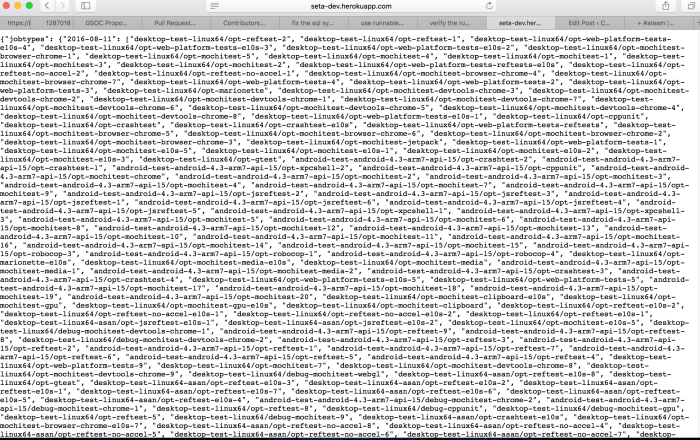
The final piece of this project is to integrate with the Gecko decision task. On the server side, we separated Taskcluster jobs from Buildbot jobs and started listing all low value jobs to ensure that we run brand new jobs by default in #PR101 and #PR113. TaskCluster can query the low value job list from the server side and can create decision task based on it (You can check it out on http://seta-dev.herokuapp.com/data/setadetails/?taskcluster=1)

Screen Shot 2016-08-11 at 11.45.18 PM

We also found a way to identify new jobs from runnablejobs.json and remove expired jobs from preseed.json in #RP112. In bug 1287018, we try to figure out how to make TaskCluster use data from SETA to schedule tasks and I committed several patches about it. The Gecko decision task is the vital part for our task scheduling and a lot of things need to be discussed in there. This is now a stretch goal for this project and I will keep working on it after GSoC work period :).

SETA rewrite-Use SqlAlchemy to instead of hardcode sql

Due to we have already make SETA to support taskcluster now,  the next thing we should do is to make it make the code become more robust and readable. That’s it, we should add more tests and documents for it. The first step, before we start to write test for it, is no longer use hardcode sql in SETA. For example.

sql = """insert into testjobs (slave, result,
duration, platform, buildtype, testtype,
bugid, branch, revision, date,
failure_classification, failures)
values ('%s', '%s', %s,
'%s', '%s', '%s', '%s', '%s',
'%s', '%s', %s, '%s')""" % \
(slave, result,
duration, platform, buildtype, testtype,
bugid, branch, revision, date, failure_classification, ','.join(failures)

It makes us hard to write test for it and cased some bugs when we need to switch database in different environment(because we have master mysql branch and heroku postgresql branch). Therefore, the solution I found is use SqlAlchemy which is a powerful and useful database toolkit for python. You can found some more information about on its office website.

Alright, to use SqlAlchemy in SETA, we should make it connects to the database, which is create a engine for it:

engine = create_engine('mysql+mysqldb://root:root@localhost/ouija2', echo=False)

The standard calling form is to send the URL as the first positional argument, usually a string that indicates database dialect and connection arguments. The string form of the URL is dialect[+driver]://user:password@host/dbname[?key=value..], where dialect is a database name such as mysql, oracle, postgresql, etc., and driver the name of a DBAPI, such as psycopg2, pyodbc, cx_oracle, etc. Alternatively, the URL can be an instance of URL.

And we need to create some database table for our new database. Classes mapped using the Declarative system are defined in terms of a base class which maintains a catalog of classes and tables relative to that base – this is known as the declarative model. And we could use Metadata to include all the models we define and bind it with our database.


class Seta(MetaBase):
    __tablename__ = 'seta'

    id = Column(Integer, primary_key=True)
    jobtype = Column(String(256), nullable=False)
    date = Column(DateTime, nullable=False, index=True)

    def __init__(self, jobtype, date):
        self.jobtype = jobtype
        self.date = date

We’re now ready to start talking to the database. The ORM’s “handle” to the database is the Session. When we first set up the application, at the same level as our create_engine() statement, we define a Session class which will serve as a factory for new Session objects and use it to query or operate the database.
In config.py


Session = sessionmaker(engine)

session = Session()


In failure.py(which is the file we need to use the database operation)


session.query(Seta).filter(Seta.date == date).delete(synchronize_session='fetch')

That’s it! And you can read some more detail in this PR. The next step for SETA rewrite is write more test for it!

The First part of SETA rewriting job been finished

With the end of GSoC midterm evaluation, I finally remember the blog and weekly maintain request. But I’m working on (make seta to use runnable api)[https://github.com/mozilla/ouija/pull/93], so I leave it aside for now. However, with the most seta rewriting job been finished now, I think it’s a good time to pick this up and write something.

The first thing I would like to mention in here, of course, is we use runnable api instead of uniquejobs table now! Thank you Kalpesh and Armenzg! I couldn’t make this happened without your help! 🙂

The uniquejobs table in SETA is about all the  jobtypes available on buildbot(we unable to recognise taskcluster jobs before we use runnable api). The jobtypes been stored in the table as a three tuple list like: [‘build platform’, ‘build type’, ‘test type’]. Here is a piece of data in table:

Screen Shot 2016-07-14 at 12.33.06 PM

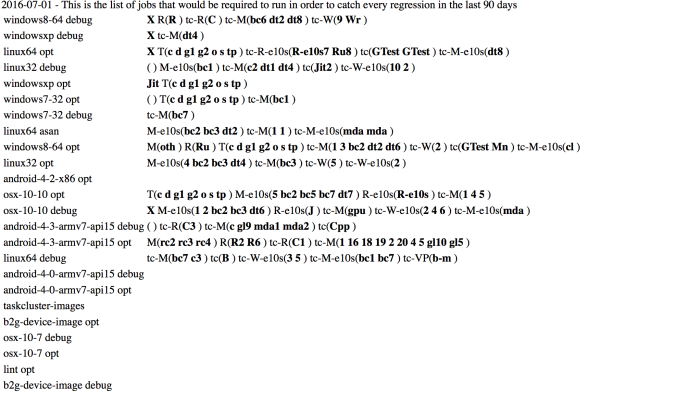
But it’s manually created by ‘/data/createjobtype’ endpoint before we use SETA which make it’s a little bot hard code and cause some bugs(e.g. This pr fix the linux 64 display issue).  Therefore, we need to use runnable jobs api to replace that. The runnable api could return both buildbot jobs and taskcluster jobs as json.  So we could simple exact the corespondent piece of data and assemble them as job information we want. Here is the PR. And SETA can show more job data than before now:

Screen Shot 2016-07-02 at 4.51.32 PM

The next step is we should move to the task decision tree and make it work with seta data. I will make a description for task decision tree in my own understanding.

Sorry  again for the blog update. I will try my best for updating it once a week.